Influencer marketing has evolved from a trendy experiment into a core strategy for brands of all sizes. But as influencer marketing budgets grow, so does the need to prove that these campaigns deliver results. This is where influencer marketing KPIs come into play.
In this comprehensive guide, we’ll walk through what influencer marketing KPIs are, why they’re important, and which influencer marketing metrics you should be tracking. We’ll also teach you how to analyze the data to continually improve your influencer marketing campaign strategy.
What Are Influencer Marketing KPIs?
KPIs (Key Performance Indicators) of influencer marketing are the measurable metrics that indicate how well your influencer campaigns are performing in relation to your goals.
In simpler terms, these are the specific numbers and outcomes you track to evaluate the effectiveness of your influencer marketing strategy.
Just as traditional marketing has KPIs like website traffic, click-through rates, or revenue, influencer marketing has its own set of metrics, including reach, engagement, lead generation, conversions, and more, that show the impact of collaborating with influencers.
At their core, KPIs for influencer marketing span three broad categories:
- Awareness metrics
- Engagement metrics
- Conversion or sales metrics
For example:
- If your goal is to boost brand awareness, you might track reach and impressions generated by the campaign.
- If engagement is a priority, you’ll look at metrics like likes, comments, shares, and engagement rate on the influencer’s posts.
- If your objective is driving sales or leads, then click-throughs, conversion rate, and ROI become critical KPIs.
I’ll cover all these specific metrics in detail in the next section.
In short, influencer marketing KPIs are your evaluation toolkit, they translate the outcomes of an influencer’s work into quantifiable data. Rather than just hoping an influencer partnership “went well,” influencer marketing KPIs let you measure exactly how well it performed.
Why Are Influencer Marketing KPIs Important?
If you still don’t know why influencer metrics tracking is important, let me give you a few reasons:
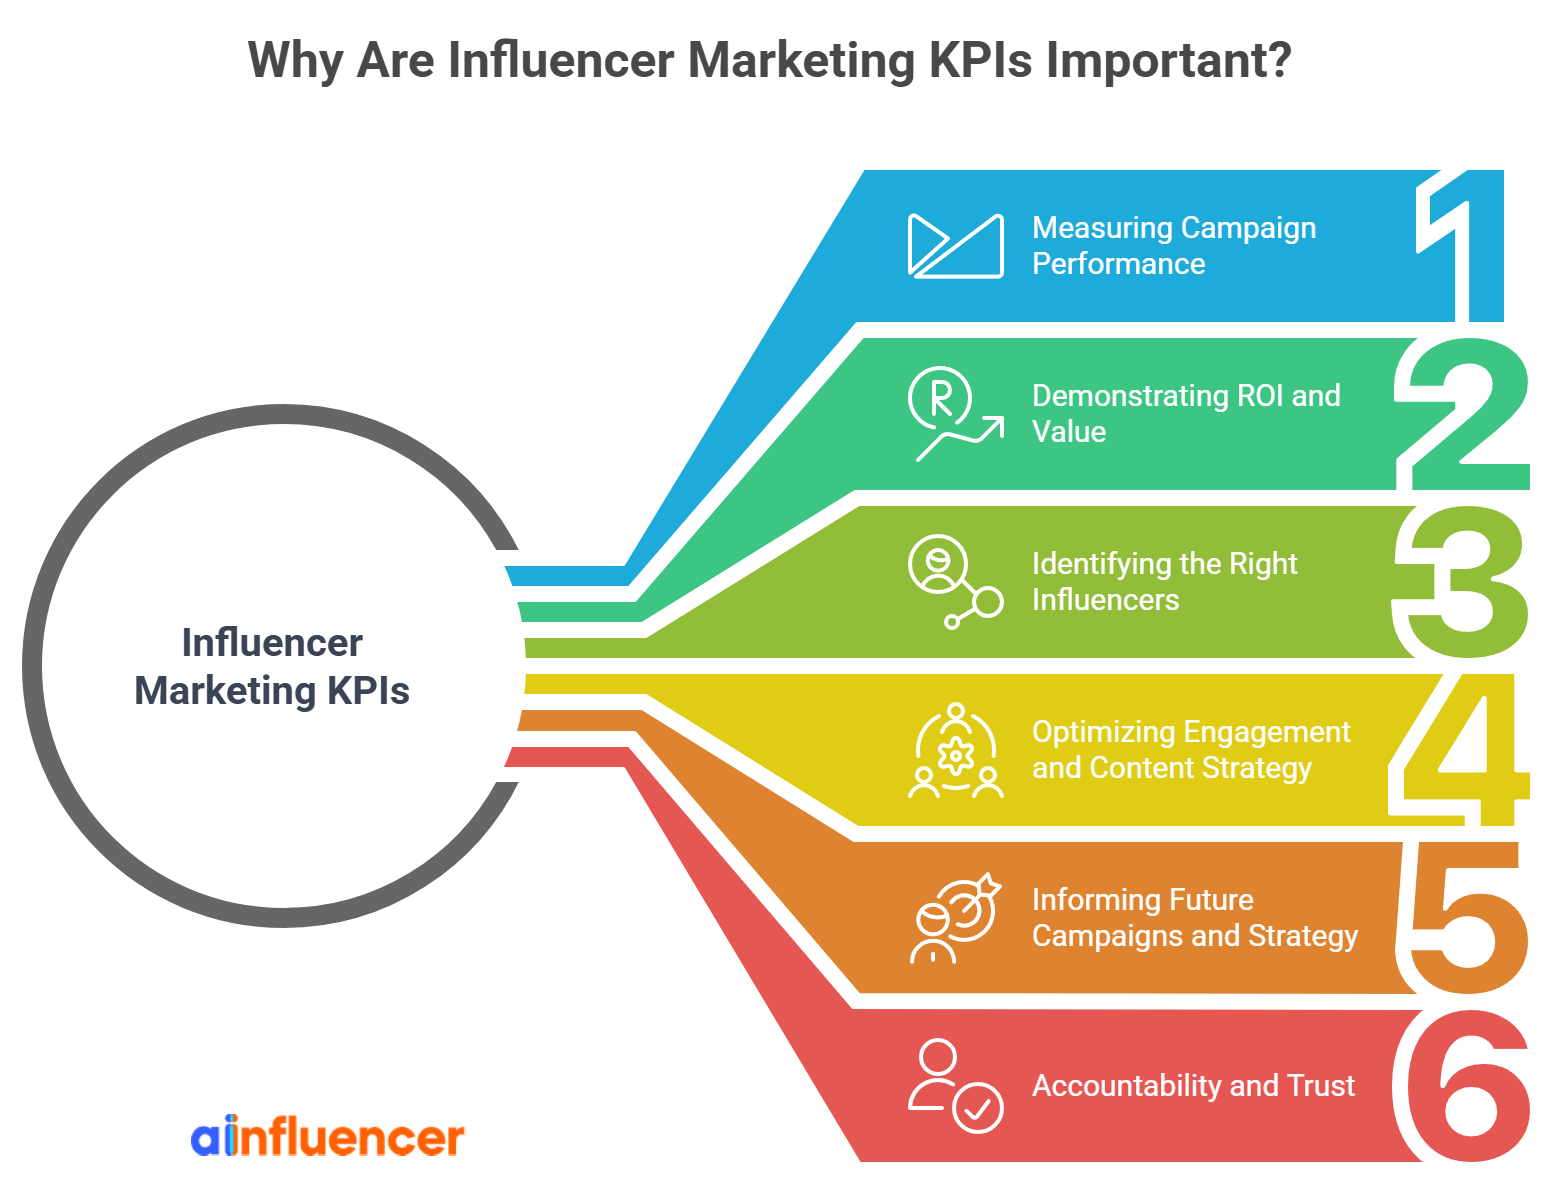
1. Measuring Campaign Performance
Influencer marketing isn’t just about creating catchy content or reaching a lot of people; its real value lies in showing measurable results. We use Key Performance Indicators (KPIs) to prove how well an influencer campaign is actually doing.
With so much digital data available today, brands expect to see solid numbers that confirm an influencer partnership delivered what it promised.
By checking these KPIs, you can quickly see which strategies or influencers are succeeding and which ones aren’t quite hitting the mark. This data-driven approach is what separates truly effective campaigns from those that just generate hype.
2. Demonstrating ROI and Value
Perhaps the biggest reason to track KPIs is to prove the return on investment (ROI) of your influencer marketing.
Marketing teams need to justify budget spend, and executives want to see a clear link between influencer fees or product giveaways and business outcomes.
Monitoring influencer marketing KPIs “helps you understand the return on investment” by comparing what you spent versus what you earned or achieved.
3. Identifying the Right Influencers
Tracking influencer marketing KPIs also helps you gauge the performance of individual influencers and make smarter partnership choices. Not all influencers are equal in delivering results.
KPIs act as a scorecard; you might discover that a micro-influencer with a smaller following brings a higher conversion rate than a mega influencer. So, for your next campaigns, you’ll focus on multiple micro-influencers rather than one mega influencer.
4. Optimizing Engagement and Content Strategy
Influencer marketing metrics aren’t just about results; they show how people are reacting to your content.
Metrics like comments, shares, and the tone of responses help you see if an influencer’s post is actually connecting with the audience. Lots of positive comments? Great! Low engagement or negative feedback? You might need to adjust your message.
For example, if a post gets many views but few interactions, the influencer could try adding a clearer call-to-action. In fact, 68% of marketers track likes, shares, and comments to measure success, because it’s not just about reach, it’s about real connection.
5. Informing Future Campaigns and Strategy
Tracking influencer marketing KPIs helps you improve over time. By looking at what worked (like top-performing content or platforms) and what didn’t (like influencers who drove traffic but no sales), you can make smarter decisions for future campaigns.
Think of KPIs as lessons that help you get better with each campaign. It’s not just about tracking results once, it’s about using that data to keep growing and improving every time.
6. Accountability and Trust
Clear KPIs make influencer marketing more accountable. They set specific goals, like link clicks or engagement rates, so both the brand and influencer know what success looks like.
This builds trust and ensures your budget goes toward results, not just content. As the industry grows, brands are shifting from vague metrics to a “prove it with data” mindset. KPIs keep everyone aligned and focused on outcomes that matter.
In summary, influencer marketing KPIs are important because they help turn a strategy that’s often hard to measure into something clear and trackable.
They give you the numbers you need to show what’s working, make smart changes, and build a successful influencer program you can repeat and improve over time.
11 Important Influencer Marketing KPIs to Measure
What exactly should you measure in an influencer marketing campaign? The answer can vary based on your goals, but there are several essential influencer marketing metrics that most brands should track.
These KPIs fall into different stages of the marketing funnel, from awareness to engagement to conversions.
Below, we break down the important influencer marketing KPIs you need to know, why they matter, and how to measure influencer marketing metrics.
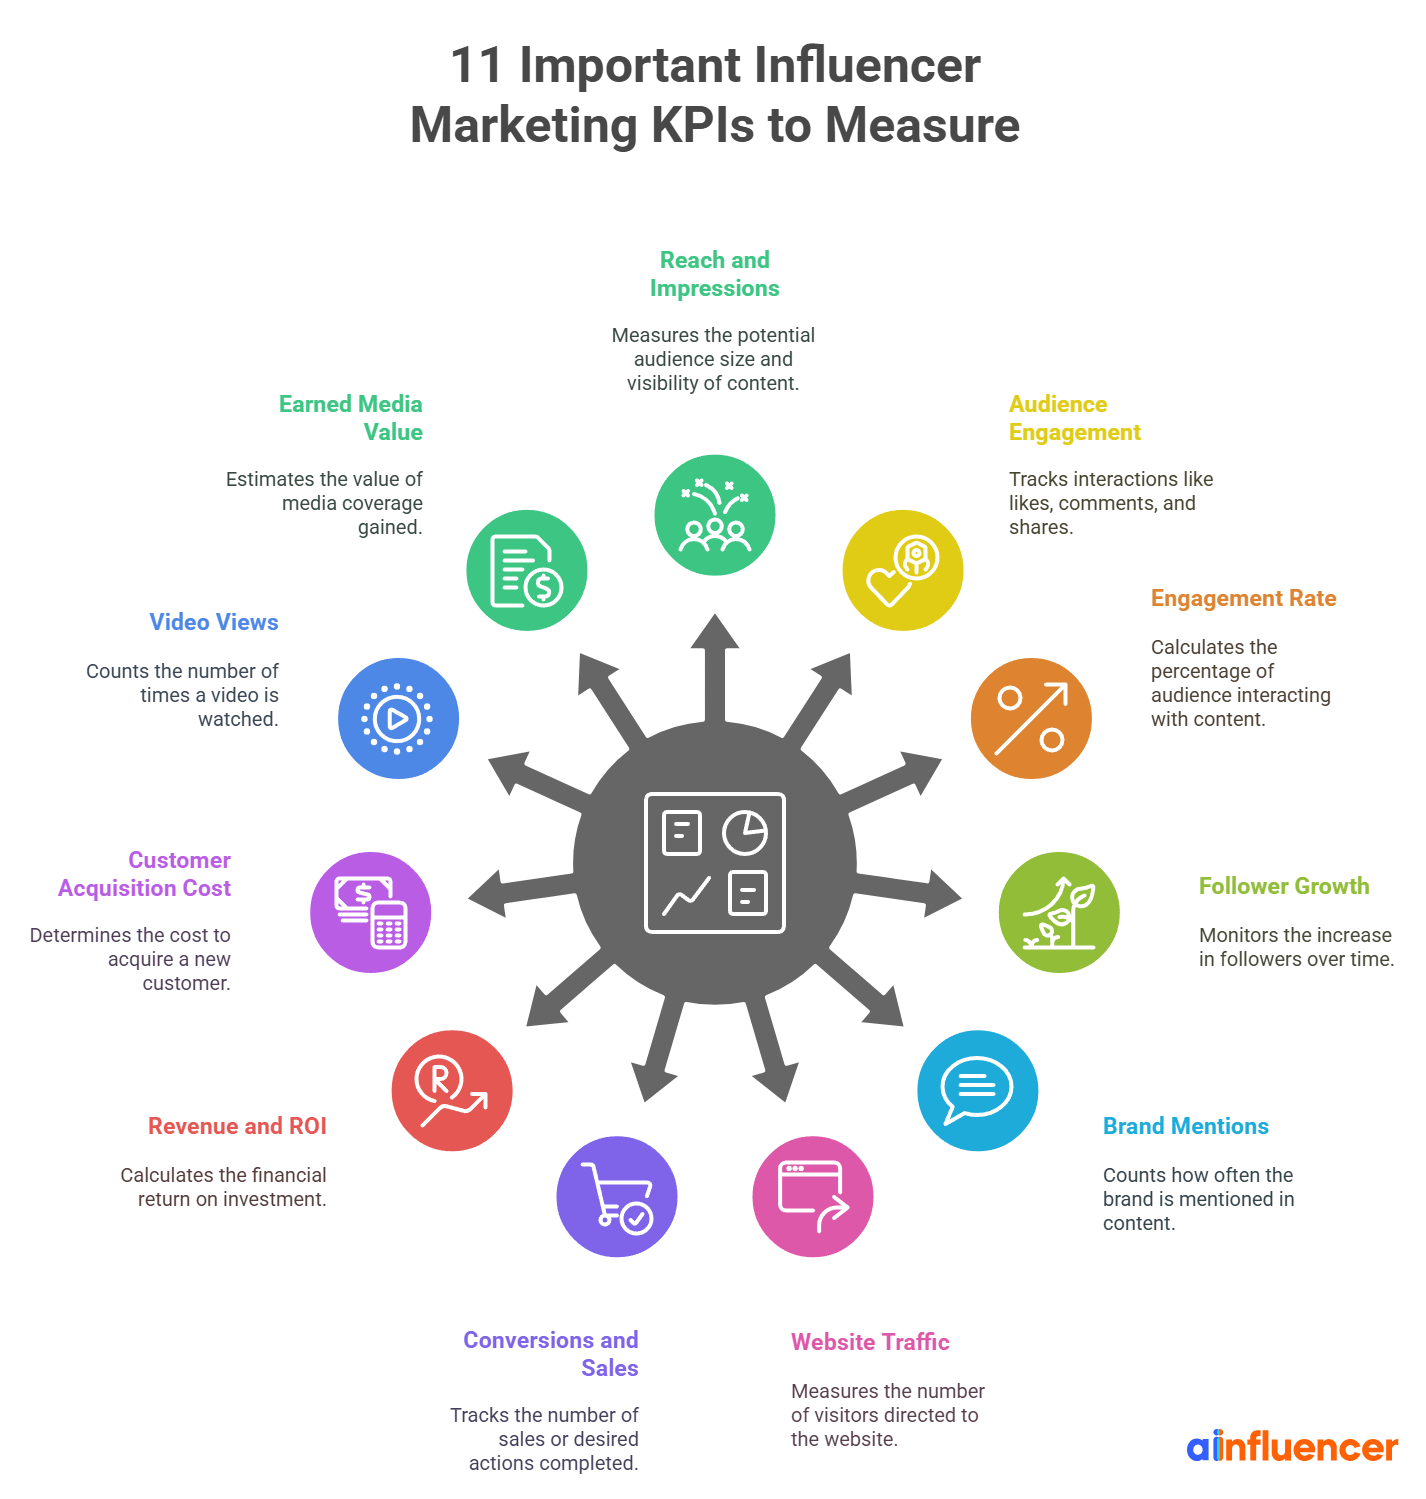
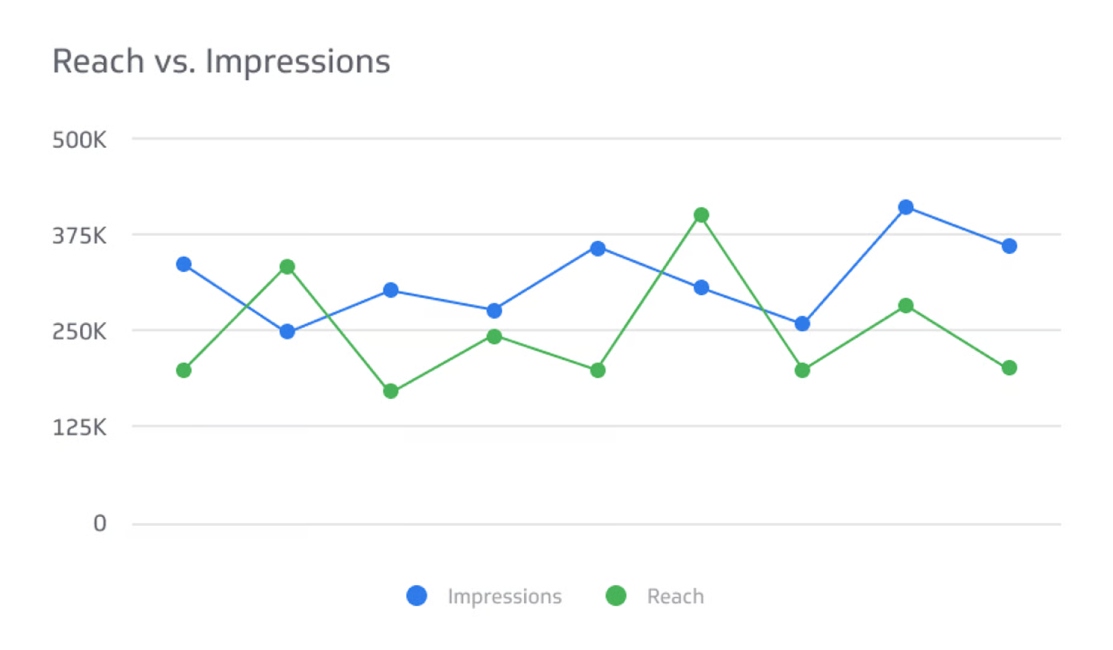
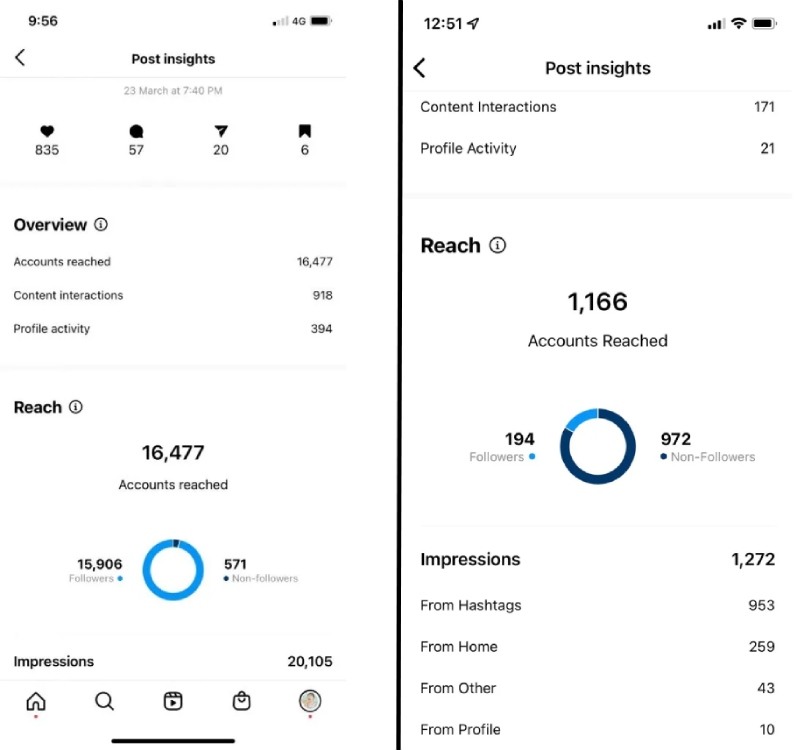
1. Reach and Impressions
Reach and impressions are key for measuring how far your influencer campaign is spreading.
- Reach shows how many unique people saw the content (each person counted once).
- Impressions show the total number of views, including if someone saw the post more than once.
These metrics help answer: How many people actually saw the influencer’s post?
For brand awareness campaigns, reach is especially important because it shows the number of people to whom you have exposed your message.
Impressions help add context by showing how often people saw the content. If impressions are much higher than reach, it usually means people saw the post multiple times, either because it was engaging or the platform pushed it more (like through Stories or Reels).
Why It Matters
High reach means your campaign reached a big audience, which is great for awareness. If reach is low compared to the influencer’s follower count, it might mean the post didn’t get seen much, possibly due to the algorithm or poor timing. That’s a sign you might need extra posts or even a different platform.
How to Use It
- Compare reach to the influencer’s follower count to see how much of their audience actually saw the post, this gives you the “reach rate.”
- Compare reach and impressions across influencers or platforms to see which ones gave you more visibility.
- You can also calculate frequency by dividing impressions by reach. A frequency of 1.2–1.5 is ideal for awareness; higher may feel repetitive, while lower might mean the content wasn’t noticed. For example, if the impressions are 144 and the reach is 120, it’s a good sign (144/120=1.2).
In the end, strong reach and impressions mean your campaign is being seen, but it’s just the first step. Next, track how many of those viewers engaged or took action.
2. Audience Engagement (Likes, Comments, Shares)
Engagement metrics show how people interacted with an influencer’s content.
These include likes, comments, shares, saves, and platform-specific actions, like sticker taps or reactions.
For example, a post might reach a million people, but if hardly anyone liked or commented, it likely didn’t leave much of an impression. On the flip side, a post with lots of likes, comments, and shares clearly made an impact.
Why It Matters
Engagement is a strong sign of content quality and audience interest.
- Comments are especially valuable; they take more effort than likes and can show real interest, questions, or intent to buy.
- Shares or Story reshares are powerful too, because they spread your content to new audiences and show people trust or like it enough to pass it along.
How to Use It
- Count the total engagements and break them down by type (likes, comments, shares, etc.).
- Calculate engagement rate (covered in the next KPI) to compare across influencers with different audience sizes.
- Look at what people are saying in the comments. Are they tagging friends, asking where to buy, or just posting emojis? Meaningful comments are more valuable than random ones.
- Also, compare performance to the influencer’s usual post engagement. If they normally get 100 comments but your campaign got 300, that’s a strong result.
- If engagement is low, it could be due to poor timing, content that didn’t fit the audience, or even algorithm changes, helpful signals for improving future campaigns.
3. Engagement Rate
When finding influencers, engagement rate is one of the main factors you should consider in choosing them. Engagement rate is a key way to measure how well influencer content performs, based on audience size. It’s usually calculated as:
(Total engagements ÷ Total followers) × 100%
Some also use reach instead of followers to see what percentage of viewers interacted. Either way, the result is a percentage that helps you fairly compare performance between influencers, no matter how big or small their followings are.
For example, 500 likes from 5,000 followers = 10% engagement rate (great!). But 500 likes from 50,000 followers = 1% (less impressive).
Why It Matters
Engagement rate shows how much the audience actually cares about the content. A higher rate means more people were interested enough to interact. That’s why it’s one of the most trusted ways to measure content relevance.
Smaller influencers (micro and nano influencers) often have higher engagement rates than bigger ones. Their audiences feel more connected and are more likely to comment, like, or share. So sometimes, a micro-influencer with 8% engagement is a better choice than a celebrity with only 1%.
How to Use It
- Calculate the engagement rate for each influencer post in your campaign.
- Compare it to industry averages or the influencer’s usual rate. For example, Instagram influencer marketing averages around 2–3%, so if your post hits 5%, that’s a strong result.
- Use these rates to see which influencers created the most effective content.
- If the rates are low, it could mean the content didn’t match the audience or it wasn’t compelling enough.
- You can also track Cost Per Engagement (CPE): CPE = Total spend ÷ Total engagements. This tells you how much each like, comment, or share costs you.
Example: If Influencer A’s CPE is $1 and Influencer B’s is $5, A gave you more engagement for your money.
4. Follower Growth and Audience Gain
Follower Growth is the increase in followers your brand gets as a result of an influencer campaign. It can happen in two ways:
- The influencer gains followers from the campaign.
- Your brand gains new followers (this is what we’ll focus on).
Campaigns, like long-term partnerships, influencer giveaways, or account takeovers, often aim to grow the brand’s social media following.
Why It Matters
New followers = more people interested in your brand.
If someone sees influencer content and then follows your page, it shows they want to hear more from you.
Follower growth is a good sign that the campaign made a lasting impression. Even if gaining followers wasn’t the main goal, it’s a great bonus KPI. More followers = more chances to convert them into future customers.
How to Use It
- Track your follower count before and after the campaign. Use tools like Instagram Insights or TikTok Analytics to see when and where growth happened.
- If you asked the influencer to tag your account or encourage people to follow, check if there was a spike during that time.
- Measure net new followers gained during the campaign.
- Look at who those followers are, do they align with your target audience?
- You can also calculate a rough conversion rate:
Example: If the influencer reached 100,000 people and 5,000 followed you, that’s a 5% follower conversion rate. - After the campaign, check if those followers stay engaged with your content. If they keep liking, commenting, or watching, they’re genuinely interested, not just a one-time click.
5. Brand Mentions and Sentiment
Brand mentions track how many times people talk about your brand on social media during and after an influencer campaign. This includes:
- Direct tags (like @YourBrand)
- Name mentions (just writing your brand name in a caption or comment)
- Hashtags related to your campaign (e.g., #YourBrandChallenge)
Along with how often your brand is mentioned, sentiment measures how people feel about those mentions. Are they positive, neutral, or negative?
Why It Matters
An increase in brand mentions shows the campaign is working; people are talking about your brand. This is great for building awareness and generating hype.
But mentions alone aren’t enough; you also want to know what people are saying. Positive comments show the campaign is going well, while negative ones could signal problems (maybe the content felt fake or out of touch).
Tracking both quantity and tone gives you a full picture of your brand’s reputation during the campaign.
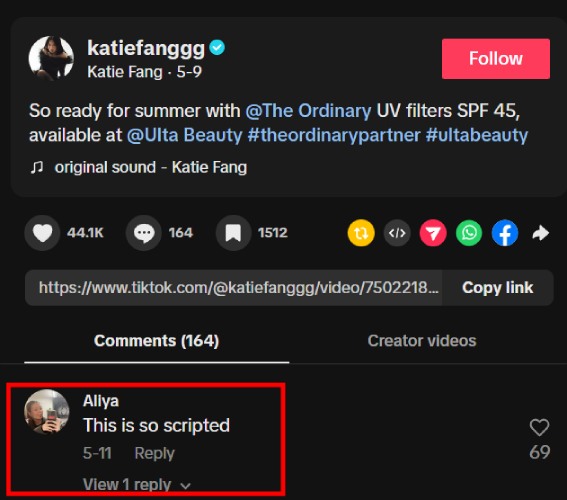
For example:
- ✅ “This looks amazing! I need to try this #YourBrand” → Positive sentiment
- ❌ “Another scripted sponsored post from #YourBrand” → Negative sentiment
How to Use It
- Use social listening tools (or platform search) to find brand and hashtag mentions during your campaign.
- Track how many mentions you get compared to normal – did the campaign increase attention?
- Break mentions into types: direct tags, keyword mentions, and hashtag uses.
- Analyze sentiment by sampling comments or using sentiment analysis software.
- Look at the comment sections under influencer posts for tone and feedback.
- If possible, compare your brand’s mentions to your competitors to see who’s getting more hype (this is called share of voice).
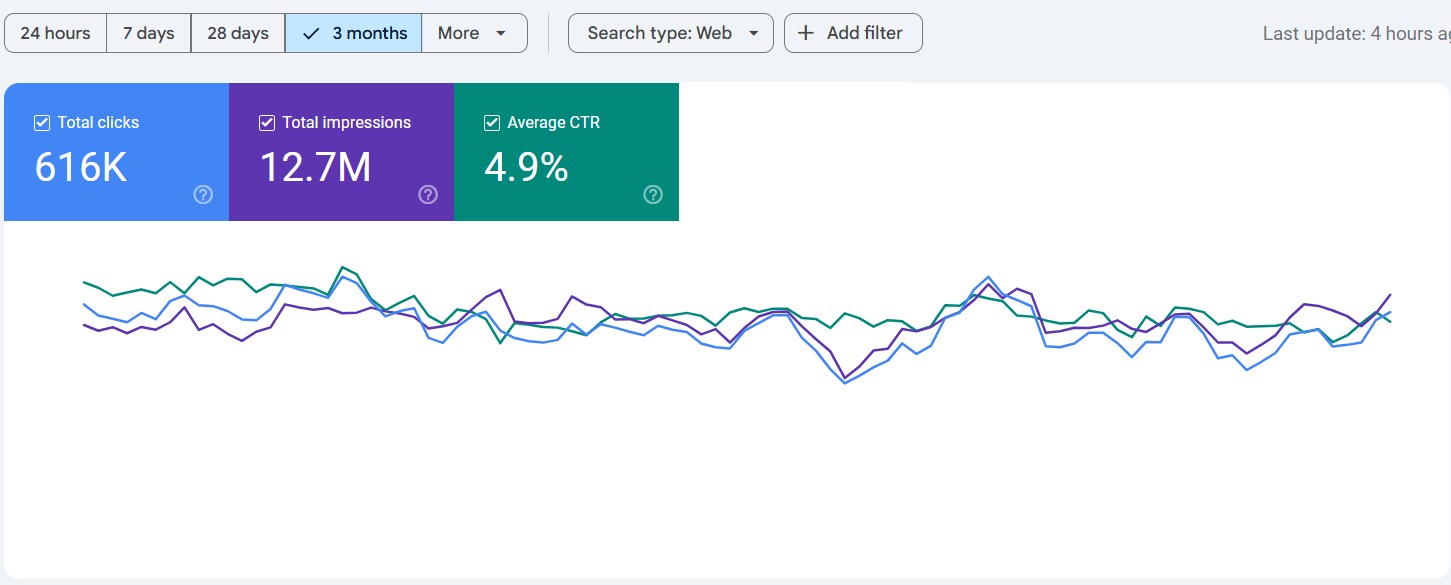
6. Website Traffic and Click-Throughs
In many influencer campaigns, the goal isn’t just to get likes or views, it’s to get people to take action, like clicking a link to visit your website, product page, or app. That’s where website traffic and CTR come in.
- Website traffic shows how many people actually visited your site because of the campaign (measured by pageviews, unique visitors, or sessions).
- CTR tells you how effective the influencer’s post or link was at getting clicks. It’s calculated as: (Number of clicks ÷ Number of views) × 100%
Why It Matters
This metric shows whether the influencer is not just creating buzz, but motivating action. Engagement (likes, comments) is good, but real value comes when users leave social media to visit your site, where they can:
- Browse products
- Sign up for a newsletter
- Make a purchase
CTR also tells you how compelling your call-to-action (CTA) is.
- High CTR = strong interest, good CTA
- Low CTR = the offer might not be clear or attractive enough
How to Use It
- Give influencers custom tracking links (like UTM URLs or discount code links) so you can see exactly how much traffic they drove.
- Use tools like Google Analytics to track what those visitors do once they land on your site (e.g., how long they stay, if they click anything else, if they bounce right away).
- Calculate and compare CTRs across different influencers and different platforms (Instagram Story vs. YouTube video vs. TikTok bio)
For example, if YouTube videos had a 2% CTR but Instagram Stories had 5%, you’ll know where to focus future efforts.
Also, check the quality of traffic:
- A high bounce rate might mean the landing page didn’t match the post or wasn’t appealing.
- Multiple pageviews or add-to-carts show that visitors were genuinely interested.
7. Conversions and Sales
Influencer campaigns are typically measured by how well they drive conversions, the actions you want users to take.
This could be making a purchase, signing up for a free trial or newsletter, filling out a form, installing an app, or any other campaign goal. The success of a campaign depends on how effectively influencers encourage these actions.
- Conversions = total number of completed goals
- Conversion rate (CVR) = (Conversions ÷ Clicks or Visitors) × 100%
Example: 1,000 people click the link, 50 purchase → 5% CVR
These KPIs sit at the bottom of the funnel, linking influencer marketing directly to ROI.
Why It Matters
Conversions are the clearest indicator of success in performance-based campaigns. While reach, engagement, and traffic are valuable, brands want to see real results, actions that contribute to revenue or lead generation.
- If an influencer drives 200 sales using a promo code, that’s tangible proof the partnership worked.
Conversion rate reveals how efficient the campaign funnel was.
- Low CVR might mean the offer wasn’t persuasive, the audience was a poor fit, or the landing page caused drop-off.
- High CVR means the content, audience, and call-to-action are aligned well.
Conversions show the influencer didn’t just entertain, they influenced behavior.
How to Use It
- Track conversions using tools like: Google Analytics, Affiliate platforms, Manual promo code tracking.
- Assign each influencer a unique link or coupon code to attribute results accurately.
- Consider attribution windows — some followers may convert days later. Time-limited codes can help track delayed actions.
Once tracked, calculate CVR:
- Compare influencers: Who drove the most conversions? Who had the highest CVR?
- Investigate gaps: If Influencer A had a 5% CVR and B had 1%, ask why — Was A’s content more persuasive? Was their audience more relevant?
Also assess conversion quality:
- Are these new customers or repeat buyers?
- Some tools track customer acquisition specifically, a strong sign of true campaign impact.
8. Revenue and ROI
When an influencer campaign is focused on sales, it’s essential to go beyond conversions and calculate revenue, the actual dollars generated.
- Revenue = Total sales from the campaign
Example: 200 orders × $50 average order value = $10,000 revenue
Once revenue is known, calculate:
- ROI (Return on Investment) = (Revenue – Cost) ÷ Cost
Or expressed as a ratio: Revenue ÷ Cost - ROAS (Return on Ad Spend) = Revenue ÷ Ad Spend
Example: ROAS of 3.0 = $3 earned per $1 spent
Why It Matters
Revenue is the clearest link to business success, as it shows the financial payoff of influencer marketing.
- Positive ROI (e.g., 150%) means the campaign generated more than it cost, the goal for most marketers.
- Negative ROI means a loss, which may be acceptable for brand awareness campaigns, but still requires explanation.
- ROAS is especially useful when evaluating paid media components of influencer campaigns (e.g., boosting posts).
Many marketers consider ROI/ROAS hard to measure due to:
- Delayed sales (followers convert days later)
- Indirect effects (word-of-mouth, repeat customers)
Still, even a rough estimate helps guide future budget decisions.
How to Use It
- Track Revenue
- Use e-commerce tools to capture sales tied to: Promo codes, UTM links, Affiliate tracking.
- Make sure you include delayed conversions.
- Calculate Costs
- Influencer fees
- Free product (retail value)
- Paid media (if you boosted content)
- Agency/internal costs (if significant)
- Influencer fees
- Calculate ROI or ROAS
- ROI:
Example: Spent $10,000, earned $15,000 →
ROI = (15,000 – 10,000) ÷ 10,000 = 0.5 or +50%
OR revenue/cost = 1.5 → “150% ROI” or “$1.50 return per $1 spent” - ROAS:
If you spent $4,000 on influencer fees + ads and earned $12,000
ROAS = 12,000 ÷ 4,000 = 3.0 (3x return)
- ROI:
If your campaign only drove $3,000 in sales, EMV suggests brand awareness value made up the difference.
Combining ROI + EMV gives a fuller view: direct revenue + estimated brand value. I’ll explain more about EMV further in the blog.
9. Customer Acquisition Cost (CAC)
CAC is the cost of acquiring each new customer through a campaign. In influencer marketing, it’s calculated as:
CAC = Total Campaign Cost ÷ Number of New Customers Acquired
For example, if your influencer campaign cost $5,000 and brought in 100 new customers, your CAC = $50 per customer
Why It Matters
CAC shows how much you spend to get a new customer. Lower CAC means better efficiency. If your Customer Lifetime Value (CLV) is higher than CAC, your campaign is likely profitable.
Influencer marketing may have a higher CAC than some channels, but it brings in high-quality customers, ones who are more engaged and loyal due to the trust established via the influencer.
CAC also lets you benchmark influencer performance against other channels like: Paid ads, SEO, and email marketing.
Even if CAC is higher, collaborating with influencers may be crucial for reaching Gen Z or younger Millennial audiences who often discover brands via influencers.
How to Use It
- Identify New Customers from the Campaign
Tracking tools help identify new and returning customers. Many e-commerce systems tag first-time buyers, but if direct tracking isn’t available, businesses can estimate based on campaign targeting, like reaching new audiences during a product launch.
- Calculate CAC
To calculate the total cost per new customer, add up all campaign expenses, including influencer fees, product sample retail value, paid promotions like boosted posts, and agency or production costs.
Then, divide the total by the number of new customers acquired through the campaign.
- Formula: CAC = Total Cost ÷ Number of New Customers
For example: $10,000 spent, 150 new customers → CAC = $66.67 - Evaluate CAC vs. CLV
- Good sign: CAC = $50 and CLV = $200 → You’re acquiring customers for 25% of their value.
- Red flag: CAC = $120 and CLV = $100 → You’re losing money per customer.
- Good sign: CAC = $50 and CLV = $200 → You’re acquiring customers for 25% of their value.
- Optimize Based on Insights
Compare CAC by:
- Influencer tier (e.g., micro vs. macro influencers)
- Platform (e.g., TikTok vs. Instagram)
- Content type (e.g., reviews vs. quick shout-outs)
- Influencer tier (e.g., micro vs. macro influencers)
- You might find that product-focused YouTube videos drive lower CAC than polished Instagram stories, insights like this guide smarter campaign choices.
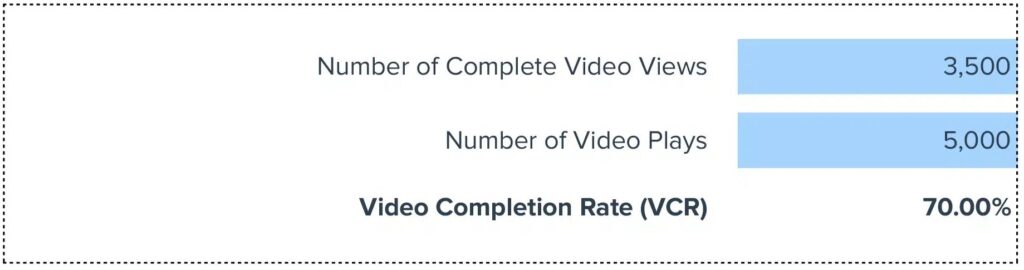
10. Video Views and Completion Rate
If your influencer campaigns include video content, view count and video completion rate (VCR) are key performance indicators (KPIs).
- View Count: Number of times the video was watched (platforms define a “view” differently, for example, 3 seconds on Facebook/Instagram, 30 seconds on YouTube).
- Completion Rate: Percentage of viewers who watched the video all the way through.
- Average Watch Time: Some platforms also provide average duration watched or percentage of total video completed.
Why It Matters
Video is a high-impact format, but it asks more of the viewer than static posts. These KPIs help answer two core questions:
- Did the content reach a wide audience? → View count
- Did the audience actually pay attention? → Completion rate
- A high view count means strong reach or good algorithmic push.
- A high completion rate shows the content held viewers’ attention, vital if your CTA, discount code, or product message appears near the end.
For example, a 3-minute YouTube video with a 70% completion rate means most viewers stayed until at least 2+ minutes, which is a high-quality engagement.
If the completion rate is low, like 20-30%, it could mean:
- Viewers lost interest early
- The hook wasn’t strong
Brand messaging was too delayed or too pushy
This affects how many people actually received the campaign’s message, a critical factor for ROI, even when views are high.
How to Use It
- Access Platform Metrics
- YouTube: Retention graphs, average view duration, percent watched
- TikTok & Instagram: Total views, completion rate (sometimes via ads or business accounts)
- Look for unique viewers, too, if available (to avoid inflating reach with repeat views).
- YouTube: Retention graphs, average view duration, percent watched
- Analyze Completion Rate
Video engagement benchmarks depend on the format. For short-form content like Reels and TikTok videos, a 50–70% completion rate is strong, while for longer YouTube videos (5–10 minutes), 40–60% is solid.
Tracking viewer drop-off points helps refine content pacing and format for better retention.
- Compare Across Videos & Influencers
Compare videos across influencers to see what held attention best. Check if early brand mentions helped keep viewers engaged and look for patterns in content tone, organic vs. scripted, that might affect retention. These insights can guide future content strategies.
- Inform Future Creative Strategy
To improve future creative strategy, place key messages or CTAs earlier if viewer drop-off is high, highlight storytelling or product use cases that kept audiences engaged, and adjust video length based on retention trends for better performance.
11. Earned Media Value (EMV)
Earned Media Value (EMV) estimates the monetary worth of the exposure and engagement generated by your influencer campaign, as if you had paid for it through traditional advertising. In simple terms, EMV answers:
“What would it have cost us to get this level of reach/engagement if we bought it as ads?”
Calculations vary, but typically assign dollar values to actions like:
- Impressions (e.g., $5 per 1,000 impressions, or $0.005 each)
- Engagements (e.g., $0.50 per like/comment/share)
Example: An influencer post with 500,000 impressions, 10,000 likes, and 500 comments might be estimated at $50,000 EMV based on industry multipliers.
Why It Matters
EMV helps you contextualize influencer results in ad-spend terms, especially valuable when:
- Direct ROI is hard to track
- Campaign goals are brand awareness or reach
- Stakeholders are used to thinking in paid media terms
For example:
- If a campaign cost $20,000 and generated $100,000 in EMV, it means a 5x return in media value, suggesting strong efficiency compared to buying ads.
- EMV also reflects the broader impact of influencer content, including virality, trust, and word-of-mouth, all summarized in a single metric.
While EMV isn’t a perfect or standardized metric, it’s widely used by influencer marketing platforms and agencies as a proxy for campaign impact when hard data like revenue or CAC isn’t available.
How to Use It
- Gather Campaign Metrics: Impressions, engagements (likes, shares, comments, saves)
- Apply Benchmark Values:
Use known or platform-recommended values, for example:
- Impressions: $5 CPM = $5 per 1,000 impressions
- Engagements: $0.50 per action
- Example Calculation:
- 1M impressions → $5 × (1,000,000 ÷ 1,000) = $5,000
- 50,000 engagements × $0.50 = $25,000
- Total EMV = $30,000
- 1M impressions → $5 × (1,000,000 ÷ 1,000) = $5,000
- Compare to Campaign Cost
- If campaign spend = $10,000 → 3x EMV return
- If spend = $40,000 → below-par efficiency
- If campaign spend = $10,000 → 3x EMV return
- Use as a Comparative Tool
- Benchmark campaigns: Campaign A had 5x EMV, Campaign B had 2x.
- Evaluate creative formats or influencer tiers based on EMV per dollar spent.
- Benchmark campaigns: Campaign A had 5x EMV, Campaign B had 2x.
These were some of the important KPIs for influencer marketing that you should consider tracking.
When running campaigns, it’s important to track the right influencer marketing key performance metrics based on what you want to achieve.
Not every campaign needs every metric, but picking the ones that match your goals is key. Some campaigns focus on building awareness, while others aim for sales.
To measure influencer marketing properly, look at KPIs like views, engagement, conversions, ROI, and Earned Media Value (EMV).
Tracking the right metrics gives you a clear picture of how well your influencer campaign is working, from how many people saw it to how much money it made.
How to Track Influencer Marketing KPIs
Identifying the right KPIs is half the battle – the other half is figuring out how to accurately track them.
Influencer campaigns can spread across multiple platforms (Instagram, YouTube, TikTok, blogs, etc.), which makes data collection a bit complex.
However, with a combination of built-in analytics, tracking tools, and good planning, you can capture all the crucial influencer marketing metrics we discussed.
Below are the key methods and tools for tracking influencer KPIs.
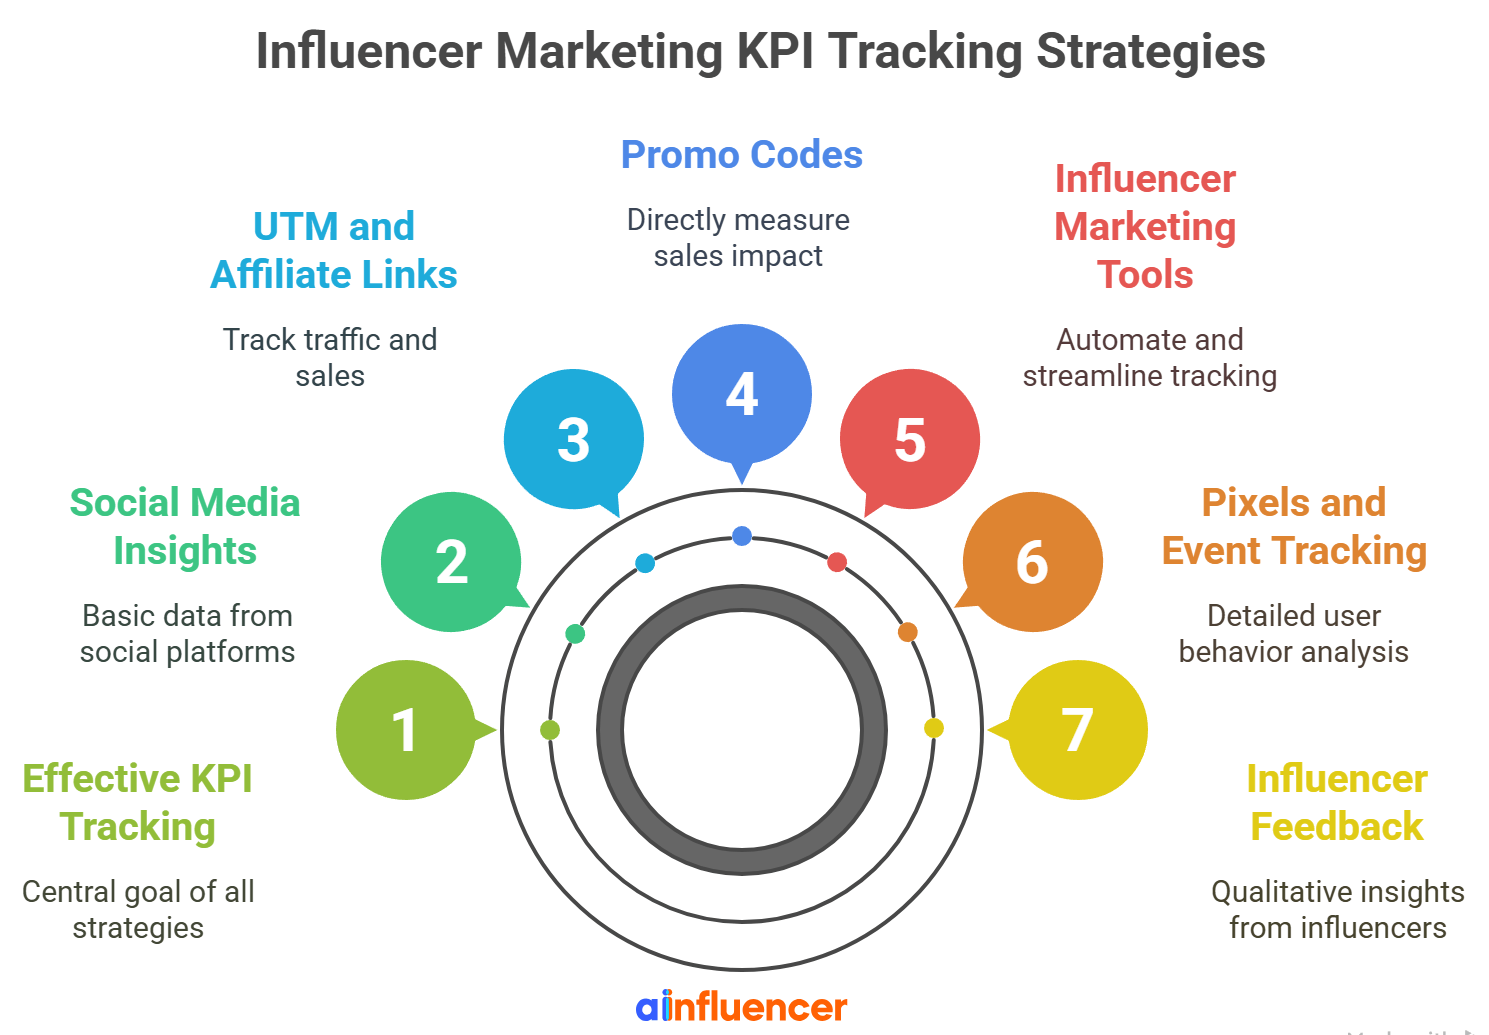
A. Use Social Media Insights to Track Influencer KPIs
The easiest way to track how well your influencer campaigns are doing is by using the built-in analytics on platforms like Instagram, YouTube, TikTok, and Facebook. These tools show important numbers like how many people saw the content, liked it, commented on it, or shared it.
Ask influencers to send you screenshots of their post performance. This helps you track important influencer marketing KPIs like reach, engagement, and who their audience is.
If you work with a lot of influencers, give them a simple form to fill out so you can easily compare the results. This is a great way to measure influencer marketing success early on.
B. Use UTM Links and Affiliate Links to Track Traffic and Sales
To track how many people visited your website or made a purchase after seeing an influencer’s post, use special tracking links. These are called UTM links or affiliate links.
Each influencer should get a unique link. When someone clicks it, you’ll see it in Google Analytics or your website dashboard.
This helps you track important metrics of influencer marketing like traffic and conversions (sales). Affiliate links are also helpful because they credit the influencer if a sale happens, which is key for tracking performance.
C. Use Promo Codes to Track Sales
Giving each influencer a custom promo code (like “LISA10” for 10% off) makes it easy to track which influencer brought in sales. Even if people don’t click a link, they might use the code at checkout, which still lets you measure the results.
This is another simple way to track influencer KPIs, like how many sales came from each influencer. Promo codes also give customers a reason to buy, which helps boost sales overall.
D. Use Influencer Marketing Tools to Save Time
If you’re working with several influencers, using a tool like Ainfluencer can help. This platform makes it easier to manage your campaigns and track everything in one place.
These tools connect to social media accounts and pull data like engagement, reach, and clicks. They help with influencer marketing metrics tracking by showing all your numbers in one dashboard. They also help you see which influencers are bringing in the best results.
E. Add Pixels and Event Tracking for More Details
If you want more detailed tracking, you can use website tools like Facebook Pixel, TikTok Pixel, or Google Analytics event tracking. These let you see what people do on your site after clicking an influencer’s link.
This helps you measure influencer marketing performance more accurately, even if someone doesn’t buy right away. You can track things like page views, add-to-cart actions, or sign-ups to understand how people interact with your brand.
F. Ask Influencers for Extra Feedback
Besides numbers, influencers can give helpful feedback. For example, they might get a lot of DMs or comments after posting, or they might run polls in their Stories and share the results.
This kind of feedback isn’t always shown in reports, but it still gives great insight into how people are reacting. You can include questions in your campaign wrap-up to gather this info.
G. Watch Out for Tracking Mistakes
Make sure you’re not counting the same sale twice if you’re using promo codes, UTM links, and affiliate links together. Also, decide how long after a post you’ll track sales (like 7 or 14 days).
Be careful about fake followers or low-quality engagement. This can make the numbers look better than they really are.
Always check an influencer’s audience before starting a campaign to make sure the data is real. And if you’re collecting data manually, double-check everything to avoid mistakes.
How to Select the Right Influencer Marketing KPIs for Your Goal
Not all influencer marketing metrics matter the same way for every campaign. One of the most important steps when planning is choosing KPIs that match your goals. Here’s how to choose the right KPIs based on what you want to achieve.
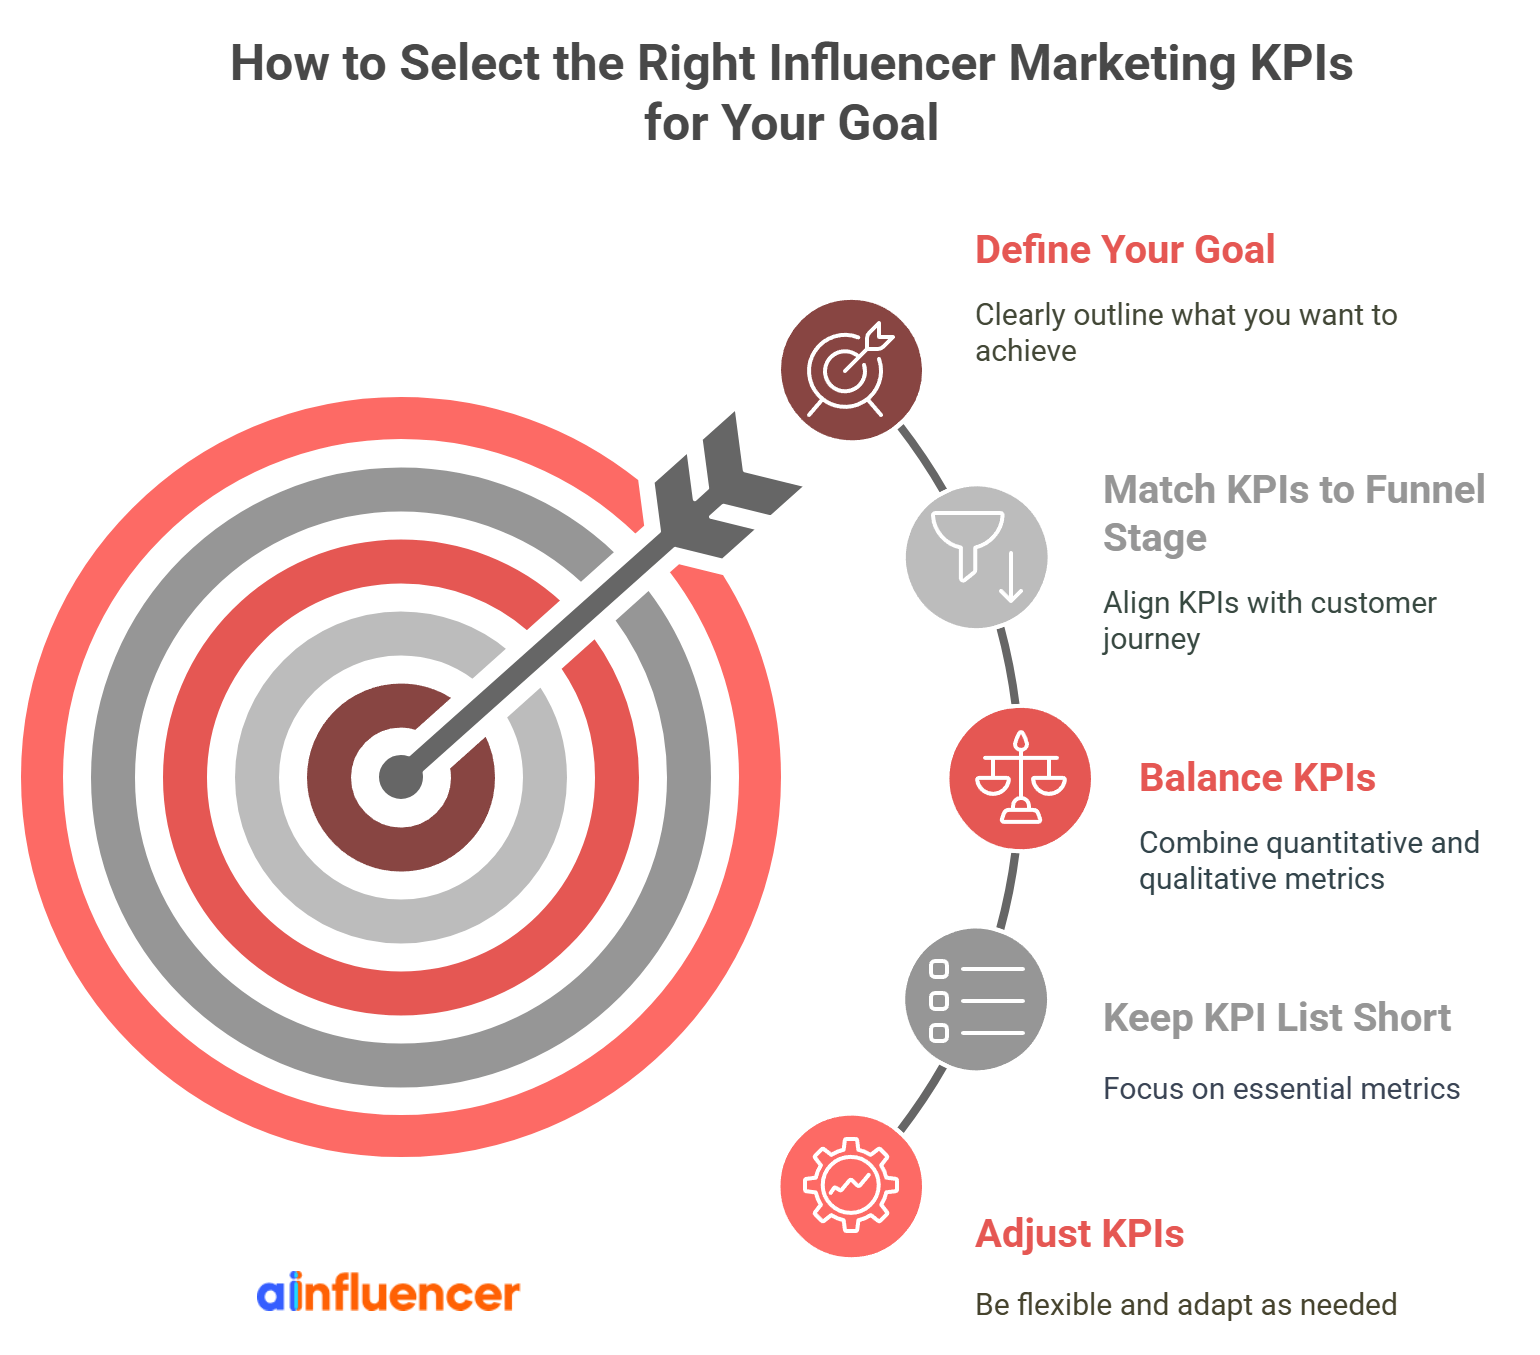
1. Start by Defining Your Goal
Before thinking about metrics, be clear on what your campaign is trying to achieve. Are you aiming for more brand awareness? Higher engagement? Website traffic? New leads? Sales?
Once your goal is clear, pick KPIs that match. For example:
- If your goal is brand awareness, track reach, impressions, and brand mentions.
- If your goal is sales, focus on conversions, revenue, and ROI.
It sounds simple, but many marketers try to measure everything at once, which can confuse the results. As experts say: if your goal is awareness, don’t worry about sales yet. And if your goal is sales, metrics like video views aren’t your priority.
Quick Tip:
Write your goal in one sentence, like: “We want to get 500 new sign-ups from this campaign,” then list the KPIs that best measure progress toward that goal.
2. Match KPIs to Your Funnel Stage
Your campaign goal usually depends on where you are in the marketing funnel. Here’s how to match KPIs to each stage:
Top of Funnel: Awareness
- Focus on reach, impressions, views, and follower growth.
- Engagement can be a secondary KPI to see if people are reacting to the content.
Example:
- Primary KPI: Reach 1 million people
- Secondary KPI: Achieve 2% engagement rate
Middle of Funnel: Consideration
- Look at click-through rate (CTR), video completions, and comment quality.
These KPIs show if people are interested and want to learn more.
Example:
- Track how many people visited your website from the influencer’s content
Or measure how long they watched a demo video
Bottom of Funnel: Conversion
- Focus on conversions, revenue, cost per conversion, or ROI.
- This is where actual results matter — sales, leads, or sign-ups.
Example:
- KPI: Generate $10,000 in sales or achieve a 3:1 return on ad spend
For longer campaigns, you might track different KPIs in each phase, like awareness KPIs early on, and conversion KPIs later.
3. Balance Quantitative and Qualitative KPIs
Most KPIs are numbers, clicks, views, conversions, etc. But some campaigns benefit from tracking qualitative indicators too, like:
- Brand sentiment (are the comments mostly positive or negative?)
- Message tone (does the content reflect your brand well?)
- Community feedback (do people say they love the product?)
If your goal includes brand image or customer trust, these softer KPIs are important. For example, a campaign could get a lot of views but still be a miss if the comments are negative.
For performance-focused campaigns (e.g., sales), you’ll mostly stick to numbers, but it’s still smart to monitor sentiment to catch any red flags early.
Quick Tip: Make a list of both number-based KPIs and softer ones. Choose which ones directly connect to your campaign goal.
4. Keep Your KPI List Short
It’s tempting to track everything, but if everything’s a KPI, nothing is. Instead, pick 1–3 primary KPIs that define success, and add a few secondary KPIs that provide extra context.
Example:
“Our main KPI was 1000 sign-ups. We got 1200. That’s a success. Our secondary KPI was cost per sign-up under $50, we hit $45. That’s a win too.”
This makes your results easy to understand and report. You can still track other metrics in the background, but don’t overload your core report.
How to choose your primary KPIs: Go back to your goal. What’s the one metric that proves you succeeded? That’s your main KPI. Others can support it.
5. Make Sure KPIs Are Realistic
A good KPI is one you can actually reach. Look at past data or industry benchmarks to help set smart targets.
For example:
- If typical influencer engagement is 2–3%, don’t aim for 10% unless you have a strong reason.
- If conversion rates are usually around 1%, aim for something close — unless your campaign is designed differently.
Also, make sure your KPIs reflect what influencer marketing can actually control. Don’t expect your campaign to boost total company sales by 30% unless influencer marketing is the only thing you’re doing.
6. Be Open to Adjusting KPIs
Sometimes, campaigns don’t go as planned, and that’s okay. If you see a different kind of success, be flexible and adjust.
For example, you aimed for 100 sales, but instead got amazing engagement and 5000 hashtag uses. So you’re shifting your KPI focus to content generation and running a follow-up campaign for conversions.
This kind of pivot shows smart decision-making, not failure, as long as you’re clear with your team about the change.
Ainfluencer: The Best Free Platform to Track and Maximize Influencer Marketing KPIs
If you’re serious about making your influencer marketing campaigns measurable, impactful, and cost-efficient, Ainfluencer is the platform you need.
As the world’s first 100% free DIY influencer marketplace, Ainfluencer gives brands everything they need to hit and exceed their KPI goals, all in one intuitive dashboard.
Whether your priority is reach, engagement, conversions, or ROI, Ainfluencer, as the best influencer search tool, offers unmatched tools to help you plan smarter, execute faster, and track results more clearly than any other platform.
Why Ainfluencer Is The Best Tool for Influencer Marketing?
✅ AI-Powered Influencer Matching: Quickly find the best-fit influencers from a database of 5M+ creators using AI filters based on niche, audience, engagement data, and more.
✅ Built-In Campaign Management: Create and manage unlimited campaigns, communicate with influencers, and negotiate deals directly within the platform, no external emails or DMs needed.
✅ Escrow Payment System: Payments are only released when influencers deliver approved content, ensuring secure and reliable transactions for both parties.
✅ Integrated Performance Analytics: Track KPIs like engagement, reach, clicks, and conversions in real time. Influencer insights and campaign data are centralized for easy reporting and optimization.
✅ AI Video Translator for Global Reach: Translate influencer videos into over 200 languages to expand your reach across international markets, boosting awareness and engagement.
✅Affiliate and E-Commerce Integration: Connect with Shopify and Google Analytics, assign coupon codes and tracking links, and monitor sales per influencer directly in the dashboard.
✅ Free to Use, Scalable for Any Business Size: Ainfluencer is free for unlimited campaigns with no platform fees, making it cost-effective and ideal for testing and scaling influencer strategies.
If you want a hassle-free influencer marketing campaign with advanced tracking tools all in one place, sign up on Ainfluencer today!
Wrapping Up Influencer Marketing KPIs
In conclusion, tracking the right KPIs is the difference between guessing and growing in influencer marketing.
Whether you’re aiming for brand awareness or driving direct sales, clearly defined metrics help you measure impact, optimize strategy, and prove ROI.
With tools like Ainfluencer and a consistent tracking framework in place, you can turn influencer campaigns into scalable, data-driven success stories. Start small, measure smart, and scale what works.
FAQs
Let’s answer some frequently asked questions about influencer marketing KPIs:
Q1. What Are the Most Important KPIs for Influencer Marketing Campaigns?
Your KPIs should align with your campaign goals. For brand awareness, track reach, impressions, and engagement rate. For conversions, monitor click-through rate (CTR), sales, conversion rate, ROI/ROAS, and cost per acquisition. Support metrics like brand mentions and sentiment help assess long-term brand impact.
Q2. How Do I Measure ROI in Influencer Marketing?
Calculate ROI as (Revenue – Cost) / Cost. Track conversions using promo codes, affiliate links, or UTMs. Include all costs (influencer fees, production, etc.) in your calculation. Use ROAS for ad-specific returns or Earned Media Value (EMV) to estimate the value of exposure when direct ROI is hard to measure. Platforms like Ainfluencer simplify tracking and attribution.
Q3. What Is a Good Engagement Rate for Influencer Posts?
Engagement benchmarks differ by platform: Instagram ranges from 2–3% for macro influencers, 5%+ for mid-tier, and 8–10%+ for micro. TikTok often sees 5–15%, while YouTube averages 4–6% of viewers engaging. More than the numbers, focus on engagement quality.
Q4. How Can I Effectively Track Influencer Marketing Metrics Across Multiple Influencers or Platforms?
To effectively track influencer marketing metrics, use influencer marketing platforms (like Ainfluencer) for centralized dashboards. Assign unique UTMs or codes to each influencer. Use Google Sheets, Google Analytics, and social listening tools for added depth.