
You probably post regularly on Instagram, but how do you measure if your followers are properly engaged with your post? How do you know what is a good engagement rate on Instagram for you?
Well, the answer to this question can be different based on many criteria. For example, your niche, follower count, account, etc, are all things that affect engagement rate on IG.
In this guide, you’ll learn what is considered a good engagement rate on Instagram and how to calculate it with Instagram metrics. Let’s dive in!
What Is Engagement Rate on Instagram?
Engagement rate on Instagram shows how much your audience interacts with your content. It includes likes, comments, shares, saves, and sometimes clicks or replies. This number helps you understand how well your content performs, how loyal your audience is, and how the algorithm treats your posts.
There are different ways to calculate engagement rate:
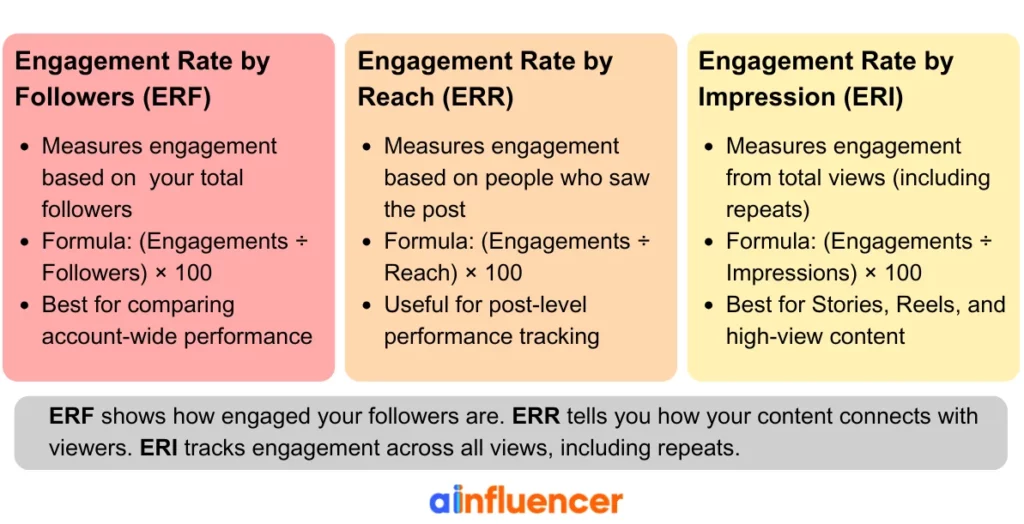
- ERF (Engagement Rate by Followers): This is the most common method. It usually gives lower percentages because it uses your full follower count.
- ERR (Engagement Rate by Reach): This gives higher percentages since reach only counts the people who actually saw the post.
- ERI (Engagement Rate by Impressions): Similar to ERR, but uses total views, including repeat views by the same person.
We’ll teach you how to calculate your ER with all of these formulas further in the blog. For now, here’s a summary of all the engagement types on Instagram:
What Is a Good Engagement Rate on Instagram? Overall Answer
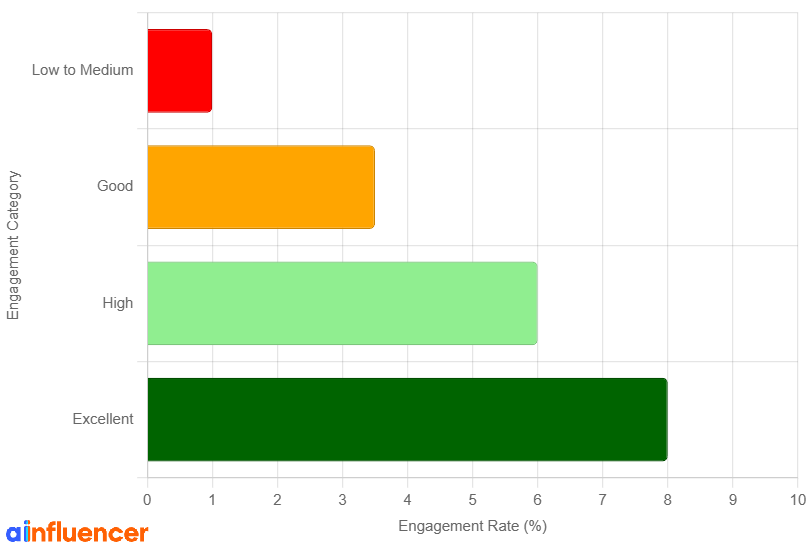
Many things can affect what counts as a good engagement rate on Instagram. Your niche, follower count, and even your location all play a role. But if we look at it in general, without diving into specific details, a good engagement rate on Instagram is:
- Below 1% → Low to medium engagement.
- 1%–3.5% → Good engagement.
- 3.5%–6% → High engagement.
- Above 6% → Excellent engagement (typically only seen in small or highly active accounts).
Take a look at this chart for a better understanding:
If we get more precise and think about what a good engagement rate is on Instagram based on follower count, then our results will change:
What Is a Good Engagement Rate Based on Follower Count
As you might know, when influencers get more followers on Instagram, their engagement rates drop. This is because it’s harder to make hundreds of thousands of people interact with their posts. Let’s see what is considered a good engagement rate on Instagram for different types of creators in this table:
| Follower Range | Average ERF | Good ERF Range |
| 1K–10K (Nano) | 2.5%–3.5% | 3%–6% |
| 10K–100K (Micro) | 1.5%–2.5% | 2%–4% |
| 100K–500K (Macro) | 0.8%–1.5% | 1.5%–2.5% |
| 500K–1M+ (Mega) | 0.3%–0.8% | 0.8%–1.5% |
However, these are all average rates. For a more accurate answer, you should compare your engagement rate to the average industry rates in the current year. This is because thousands of digital creators are appearing every year, and the meaning of “Good engagement rates” are constantly changing. Let’s take a look at the 2025 benchmark report:
What Is a Good Instagram Engagement Rate by Industry and Niche
Usually, benchmarks differ by calculation method. We have prepared a compilation from reliable 2025 reports like Hootsuite. We mainly used ERF (Engagement Rate by Followers) because it’s the most common method, and we added ERR when needed for extra coverage.
Here is the 2025 Instagram engagement rate benchmark report for every industry:
| Industry | Avg ERF (By Followers) | Avg ERR (By Reach) | Notes |
| Consumer Goods & Retail | 1.8% | 1.8% | Reels do better with 2.1% reach rate. |
| Dining, Hospitality, & Tourism | 3.1% | 1.9% | Strong visuals help; Reels get 1.7% reach rate. |
| Financial Services | 1.8% | 1.8% | Reels are lower at 1%; rules limit creativity. |
| Government | 3.5% | 3.2% | Public service posts do well; Reels reach 2.3%. |
| Healthcare, Pharma, & Biotech | 1.6% | 1.6% | Reels reach 1.3%; strict rules lower engagement. |
| Media & Entertainment | 2.0% | 2.0% | Reels match at 2%; viral content helps engagement. |
| Non-Profit | 4.4% | 2.2% | Reels do better at 2.6%; emotional stories boost engagement. |
| Real Estate, Legal, & Professional Services | 3.7% | 2.9% | Reels reach 2%; visual tours work well. |
| Construction, Mining, & Manufacturing | 4.4% | 2.8% | Reels reach 2.6%; strong visuals help even in B2B. |
| Education | 4.2% | N/A | Higher education beats the average by 4x in some reports. |
| Technology | 3.3% | N/A | Often below average due to too much content. |
| Fashion | 0.15-0.36% | 1.24% (apparel-specific) | Below median. Engagement drops because of high competition. |
| Food & Beverage | 0.40-0.63% | 1.8-2.2% | Based on a social media industry report, food & beverage carousels outperform Reels. Reach grew +20% in 2025, but interactions dipped due to saturation. |
| Health & Beauty | 0.14-0.32% | 1.19% (makeup/beauty) / 1.39% (wellness) | Lowest engagement across platforms due to saturation and extreme competition. Reels perform better than other types of content, though. |
| Sports Teams | N/A | Above median | Strong overall performance; second-best in engagement. |
📌Note: A good engagement rate is usually 20–50% higher than the benchmark in your industry. It means that if the average engagement rate in your industry is, say, 2%, then a “good” rate would be between 2.4% and 3%.
How to Calculate Your Engagement Rate? 3 Easy Methods
To calculate your engagement rate on Instagram, you’ll need two things: your total engagements and a reference number (followers, reach, or impressions). Here’s how each method works:
1. How to Calculate Engagement Rate by Followers (ERF)
Formula: (Total engagements ÷ Total followers)×100
You can use this to measure overall account or post performance. In this formula, engagements include likes, comments, shares, saves, and sometimes replies.
Example: A post with 100 likes, 20 comments, 10 saves, and 5 shares = 135 engagements. If you have 10,000 followers, ERF = (135 ÷ 10,000) × 100 = 1.35%.
A “good” ERF is 1-3% (above the 0.45% overall average). In this case, our example has a pretty good engagement rate.
Also, you can use Instagram engagement checker tools that calculate your engagement rate for you. For example, Instagram Insights (free, in-app) provides per-post and account-level data. Here is how it looks:
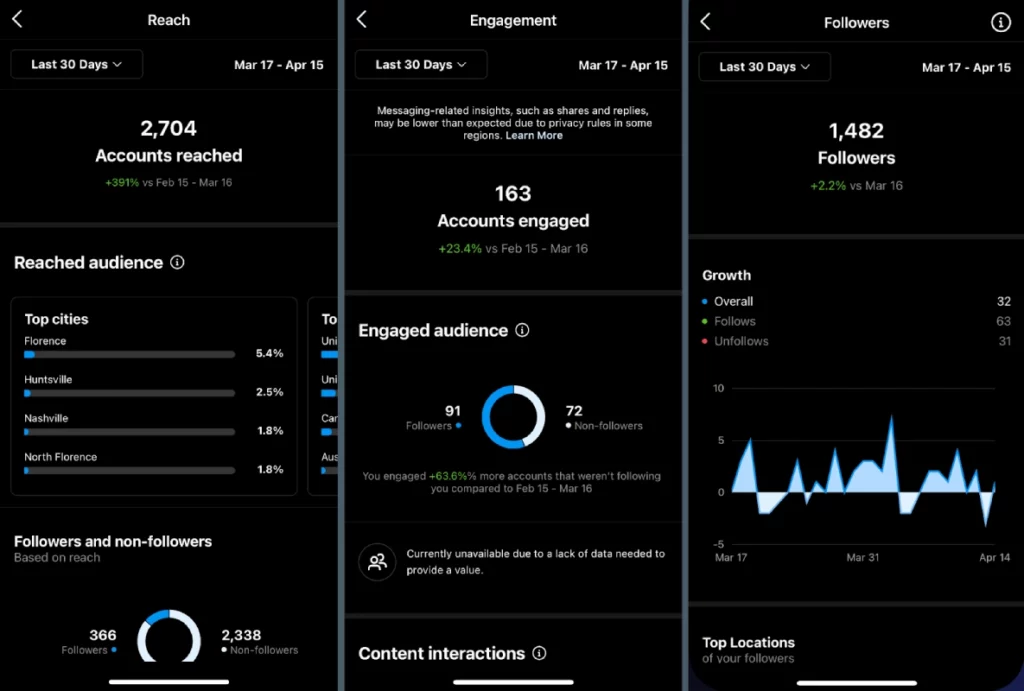
Other third-party platforms like Hootsuite, Sprout Social, or Socialinsider automate calculations too. You can also use a dedicated Instagram Engagement Tool to quickly analyze engagement rates, compare posts, and understand how your performance stacks up against similar accounts—without doing manual calculations.
2. How to Calculate Engagement Rate by Reach (ERR)
Formula: (Total engagements ÷ Reach)×100
In this formula, Reach is the number of unique users who saw your post.
To gather a reach for your post, collect the same engagements (likes, comments, saves, shares) and find the reach (unique accounts reached) via Instagram Insights. If you want to calculate the ERR of multiple accounts, use average engagements and reach.
Also, this method usually gives higher percentages than ERF. Let’s give you an example:
Same post we mentioned above with 135 engagements and 2,000 reach = (135 ÷ 2,000) × 100 = 6.75% ERR.
A “good” ERR is 3-5% (above the 2% average). Once again, our example has a pretty good ERR, too.
Lastly, if you want to use tools that will do the calculation for you, tools like Iconosquare or Later offer detailed ERR breakdowns.
3. How to Calculate Engagement Rate by Impressions (ERI)
Formula: (Total engagements ÷ Impressions)×100
In this formula, Impressions count all views, including multiple views by the same person. Again, you can get your impression from Instagram Insights. Let’s say our post with 135 engagements has 4000 impressions. Then our ERI would be:
(135 ÷ 4000) ×100 = 3.37% ERI
This method is useful for posts with high repeat views.
Lastly, tools like Socialinsider or Later can track ERI over time if you don’t want to calculate ERI by hand.
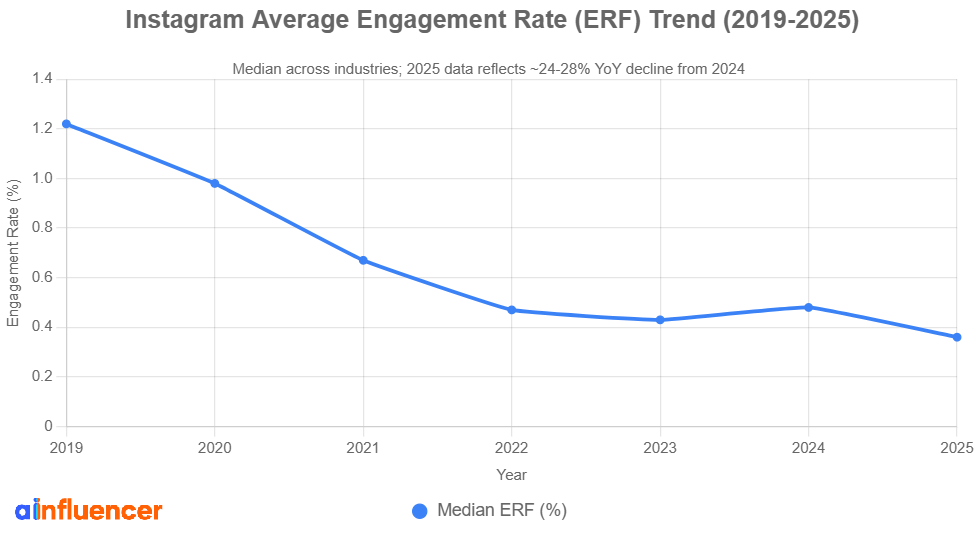
How Has Instagram Engagement Rate Changed Over Time?
In 2025, average engagement rates dropped by 24–28% compared to previous years. This is due to algorithm changes, too much content, and changing user behavior. In the previous section, we reviewed the ER benchmark for each industry. Now, let’s take a look at the overall results:
Engagement Rate by Follower:
- Overall Average Engagement Rate: 0.45–0.50%
- Instagram Carousels Engagement Rate: 0.55%
- Instagram Reels Engagement Rate: 0.50%
- Instagram Static images Engagement Rate: 0.45%
- Good performance: 1–3%
- Excellent (especially for small accounts): Above 3%
Engagement Rate by Reach:
For ERR (engagement based on the number of people who actually saw the post), the average is around 2%. Although Reels are slightly lower at 1.9%. A strong ERR is typically 3–5% or more, depending on your niche and audience size.
Influencer-specific ERF rates:
Influencers on Instagram usually have an engagement rate between 1.93% and 3.45%, with nano-influencers (1K–10K followers) getting the highest rates.
As influencers get more followers on Instagram, their engagement rates drop. This is because it’s harder to make hundreds of thousands of people interact with your posts.
If you want to have a good engagement rate on Instagram, post consistently, use trending or original audios, and write interesting captions with hashtags. Also, find the best time to post on Instagram to get the highest engagement rates for your posts.
Wrapping Up
In conclusion, a good engagement rate on Instagram has changed every year. Currently, a good overall engagement rate (ER) on Instagram is around 0.60% or higher when measured by followers (ERF). If measured by reach (ERR), a good engagement rate is 3–5% or higher.
These numbers might go lower in 2026, because more and more digital creators are joining the platforms and occupying niches.
If you want to stand out and have a high ER, you need to have a plan, strategy, and knowledge about Instagram’s algorithm.
FAQs
Let’s answer some frequently asked questions about “what is a good engagement rate on Instagram”:
Aim for an engagement rate that’s 20–50% higher than your industry average. For most accounts, 1–3% (ERF) is solid, and 3–5% (ERR) is strong. Smaller accounts can aim higher, while larger ones may see lower rates. Always compare against similar accounts in your niche.
Smaller accounts (under 10K) average 1.5–3.5% ERF. Mid-sized accounts (10K–100K) see 1–2%. Large accounts (100K+) often fall below 1%. Rates drop as follower count increases.
As follower count grows, engagement rate usually drops. Smaller audiences tend to be more loyal and active. Larger accounts face more passive followers and algorithm challenges. That’s why nano- and micro-influencers often outperform bigger ones in ERF.
For influencers, a good ERF is 2–3%, with 3%+ considered excellent. Nano-influencers often hit 3–5% or more. Micro-influencer creators average around 1.5–2.5%. Brands value high engagement over just follower count.
For brands, 1–2% ERF is a healthy range. Reaching 2.5–3% is strong, especially for niche or lifestyle brands. Smaller brand accounts may see higher rates than large ones. Consistency and content quality matter more than size alone.
An ERF below 0.5% is generally considered low. It may signal weak content, poor targeting, or inactive followers. Low rates are more common in saturated industries like beauty or fashion. Improving content quality and relevance can help boost it.
An ERF above 3% is excellent, especially for smaller accounts. For ERR, 5%+ is a strong sign of high-performing content. These rates show strong audience interest and algorithm favorability. They’re often seen in niche creators or standout campaigns.
Benchmarks vary by industry and content type. Non-profits, education, and construction often see higher rates (3–4%+ ERF). Health, beauty, and fashion tend to be lower due to saturation. Always compare your rates to others in your specific niche.
Yes, carousels and Reels usually get higher engagement than single photos. Carousels average 0.55% ERF, Reels around 0.50%, and photos about 0.45%. Reels can go viral but may have lower ERR due to a wide reach. Mixing formats helps keep your audience engaged.
A good engagement rate on Instagram Reels is typically around 1.9% to 2.5% when measured by reach (ERR). Rates above 3% are considered strong, especially for smaller accounts or niche content. Reels often perform better than static posts due to Instagram’s algorithm favoring video, but results vary by industry and audience.